🌞 Introduction
In solar energy analysis and system design, understanding climate data is essential to predicting energy production and optimizing system performance. Two fundamental types of meteorological datasets are used for these analyses: Typical Meteorological Year (TMY) data 📊 and historical time series data ⏳. Each dataset serves different purposes and has unique advantages, particularly when analyzing solar irradiance ☀️, which is critical for solar PV and thermal applications.
🔍 What is Typical Meteorological Year (TMY) Data?
Definition: TMY data is a synthesized dataset that represents a year of typical meteorological conditions for a given location. It is constructed by selecting representative months from long-term historical weather records to create a statistical average of conditions that best depict a “normal” year.
📌 Key Features:
✅ Derived from 20 to 30 years of historical weather records. ✅ Represents an average climate pattern, not an extreme year. ✅ Contains hourly weather parameters, including solar radiation, temperature, humidity, wind speed, and atmospheric pressure. ✅ Used for solar system design, energy modeling, and building simulations.
📈 How is TMY Data Created?
The creation of TMY data follows a structured process to ensure that the selected months best represent long-term climate conditions without extreme outliers. Below is a numerical example demonstrating this process:
1️⃣ Data Collection: Assume we have 30 years of solar irradiance data (measured in kWh/m²) for a specific location.
- January Irradiance Data (kWh/m²): [4.5, 4.7, 4.6, 4.8, 4.4, 4.9, …, 4.6]
- February Irradiance Data (kWh/m²): [5.0, 5.2, 5.1, 5.3, 4.9, 5.4, …, 5.1]
- This continues for all 12 months.
2️⃣ Determine Monthly Averages: Calculate the long-term average irradiance for each month:
- January Average = (4.5 + 4.7 + … + 4.6) / 30 = 4.65 kWh/m²
- February Average = (5.0 + 5.2 + … + 5.1) / 30 = 5.15 kWh/m²
3️⃣ Select Representative Month: Identify the year where the monthly value is closest to the long-term average.
- For January, assume the irradiance values in Year 12 was 4.66 kWh/m² → This becomes the January dataset for the TMY file.
- This process is repeated for all 12 months.
- The selected months may come from different years, ensuring that the data accurately represents an average climate pattern while avoiding outliers.
4️⃣ Assemble the TMY Dataset: The selected months from different years are stitched together to form a full year of hourly meteorological conditions.
5️⃣ Validation: Ensure consistency across parameters such as temperature, wind speed, and humidity to avoid unnatural transitions between months.
🌟 Example: Imagine designing a solar PV system in Phoenix, Arizona. Instead of using an arbitrary year that may have extreme weather conditions, a TMY dataset ensures that system performance is modeled based on climatologically representative data, leading to more reliable energy yield predictions. ✅
📚 Sources of TMY Data:
🌍 NREL (National Renewable Energy Laboratory) provides TMY datasets such as TMY2 and TMY3 for the United States. 🌍 Meteonorm, PVGIS, and other international databases provide similar datasets worldwide.
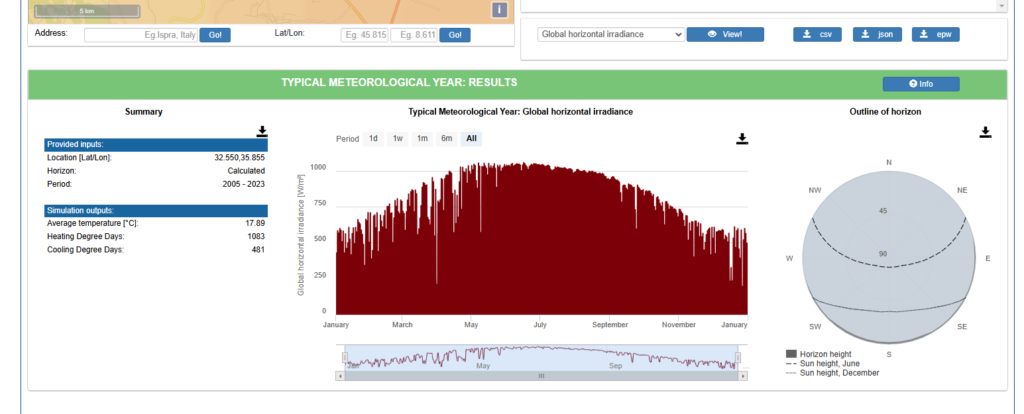
📊 The above screenshot from PVGIS shows the TMY Global Horizontal Irradiance (GHI) data for a location in Irbid city, Jordan. The graph illustrates the annual distribution of solar irradiance, which is essential for solar energy system design and performance analysis.
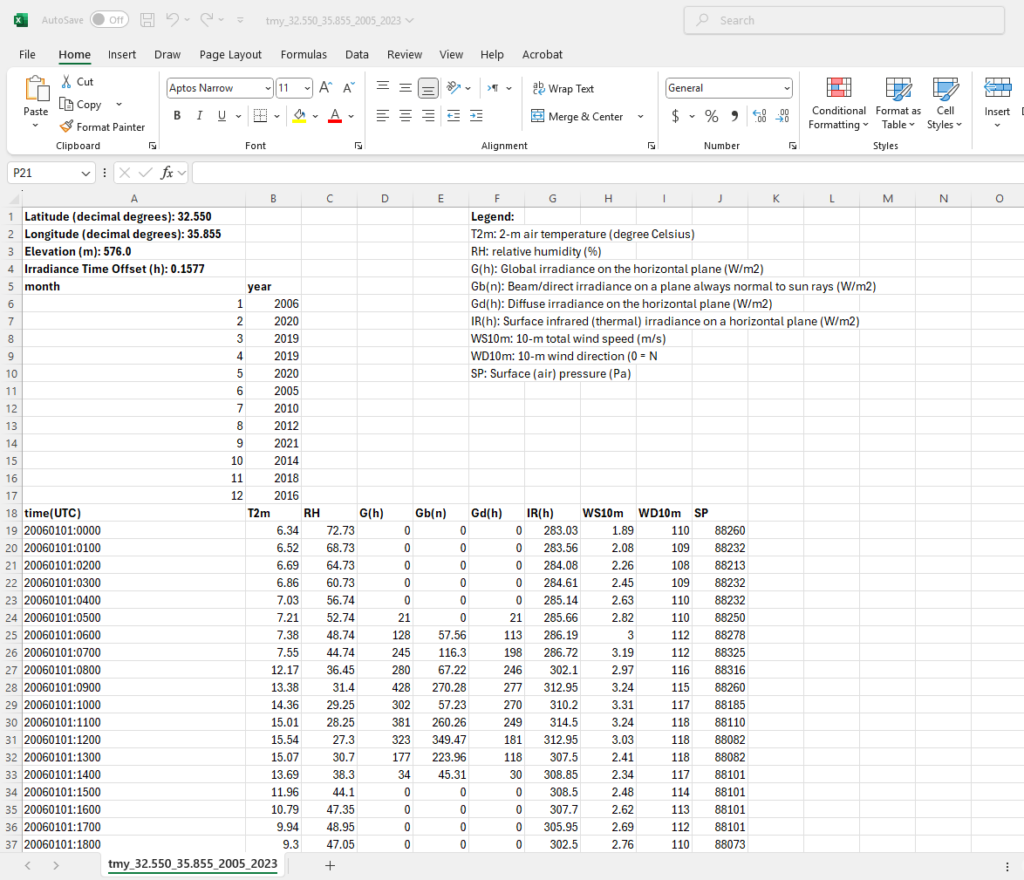
📋 The above screenshot displays the TMY 8760 dataset for the same location in Irbid, Jordan. This dataset contains hourly weather records for an entire year, including key parameters such as air temperature, relative humidity, global irradiance, beam irradiance, diffuse irradiance, surface infrared irradiance, wind speed, wind direction, and surface air pressure. This data is crucial for high-resolution energy modeling and performance assessments.
📅 What is Historical Time Series Data?
Definition: Unlike TMY data, historical time series data includes actual recorded weather conditions for specific years. It provides a detailed chronological record of past weather variations, including anomalies like heatwaves, storms, and unusually high or low solar irradiance.
📌 Key Features:
✅ Contains year-by-year, month-by-month, or even hour-by-hour recorded weather parameters. ✅ Captures extreme weather events, which TMY data smooths out. ✅ Used for performance verification, system diagnostics, and risk analysis.
📊 Example Applications of Historical Data:
📌 Assessing the Impact of a Heatwave on Solar PV Output
- Suppose a solar farm in Texas recorded lower-than-expected energy production in August 2023.
- Historical time series data shows that the region experienced prolonged high temperatures exceeding 45°C 🔥, which caused solar panels to operate with reduced efficiency due to temperature-related losses.
📌 Determining the Effect of Heavy Cloud Cover on Energy Production
- A solar system in Germany was installed based on TMY data that represented an average climate year.
- However, in 2022, historical data revealed that cloud cover was significantly higher than in previous years 🌥️, leading to reduced solar generation.
📌 Wind and Dust Impact on Solar Performance in Desert Climates
- In a solar project in Saudi Arabia, historical weather records indicated frequent sandstorms and high wind speeds 💨.
- By examining dust accumulation trends using past data, maintenance schedules for panel cleaning were optimized, improving long-term energy yields.
🎯 Conclusion
Both Typical Meteorological Year (TMY) data and historical time series data play essential roles in solar energy projects. TMY data provides a representative climate model for design and forecasting, while historical data offers real-world conditions for diagnostics, validation, and risk assessment. Additionally, 8760 data is a key component in detailed energy modeling.
🛠️ Understanding when and how to use each dataset ensures accurate solar energy predictions, optimized system performance, and efficient project planning. ✅
🔆 What’s your experience using TMY or historical data? Let’s discuss in the comments! 💬
 Commercial BESS Applications: Unlocking Value with Battery Energy Storage SystemsAll News and Articles Article
 Understanding Typical Meteorological Year (TMY) Data and Historical Time Series Data in Solar Energy ApplicationsAll News and Articles Article General Topics
 Best Practices for Diagnosing Faults in a Solar PV SystemAll News and Articles Article General Topics
 Artificial Intelligence (AI) in Solar PV: Industry RevolutionAll News and Articles Article
 Scholarships Available For Ph.D. | The University of Virginia, Virginia, USAScholarships & More
 On-Grid Solar PV System Design & Installation Course (20hrs) | LiveCourse,Live,Solar Photovoltaic
  Solar PV Mounting Structure Design Course-EE217S | LiveCourse
  Sketchup PV System Modeling (EE215S)Self-Paced
  PV System Design & Production Simulation Course (EE216S)-2021Course,Live,Self-Paced
  Solar PV Mastery Package Training Program (50hrs)-LiveCourse,PV Mastery Package,Self-Paced

0 responses on "Understanding Typical Meteorological Year (TMY) Data and Historical Time Series Data in Solar Energy Applications"