Key Takeaways
- Capacitor banks supply reactive power (kVAR) locally, so inductive loads draw less reactive current from the source.
- Correcting power factor from 0.75 to 0.95 on a 500 kW load cuts line current by roughly 21% and I²R losses by nearly 38%.
- Lower reactive current flow reduces the I·X voltage drop along feeders, flattening the voltage profile and freeing transformer and cable capacity.
- Over-correction and harmonic resonance are the two failure modes that turn a good capacitor application into an expensive problem – size and locate banks deliberately.
What a Capacitor Bank Is
A capacitor bank is an assembly of individual power capacitor units connected in series and parallel to deliver a specified amount of reactive power at a given voltage. In a power system its job is narrow and valuable: it acts as a local source of leading reactive power (kVAR) that offsets the lagging reactive power drawn by inductive equipment. Banks appear as fixed or switched shunt installations on distribution feeders and in substations, as well as capacitor cabinets bolted to motor control centers inside industrial plants.
The reason they matter is that most of the load on a real network is inductive. Induction motors, transformers, ballasts, and arc furnaces all need a magnetizing current that lags the voltage. That magnetizing current does no useful work, but it still has to be carried by every conductor, transformer, and generator between the load and the source. Capacitors draw a current that leads the voltage, so when you place them near the inductive load, the two reactive currents partially cancel and the network upstream sees a smaller net current.
Why Engineers Install Them
The core driver is power factor correction, and the motivation is mostly economic and physical at the same time. Utilities bill many commercial and industrial customers a penalty for poor power factor, because reactive demand consumes capacity that the utility has to build and maintain without selling any energy. Beyond the tariff, a low power factor wastes the customer’s own infrastructure: cables and transformers sized for apparent power (kVA) hit their thermal limit long before the real load (kW) does.
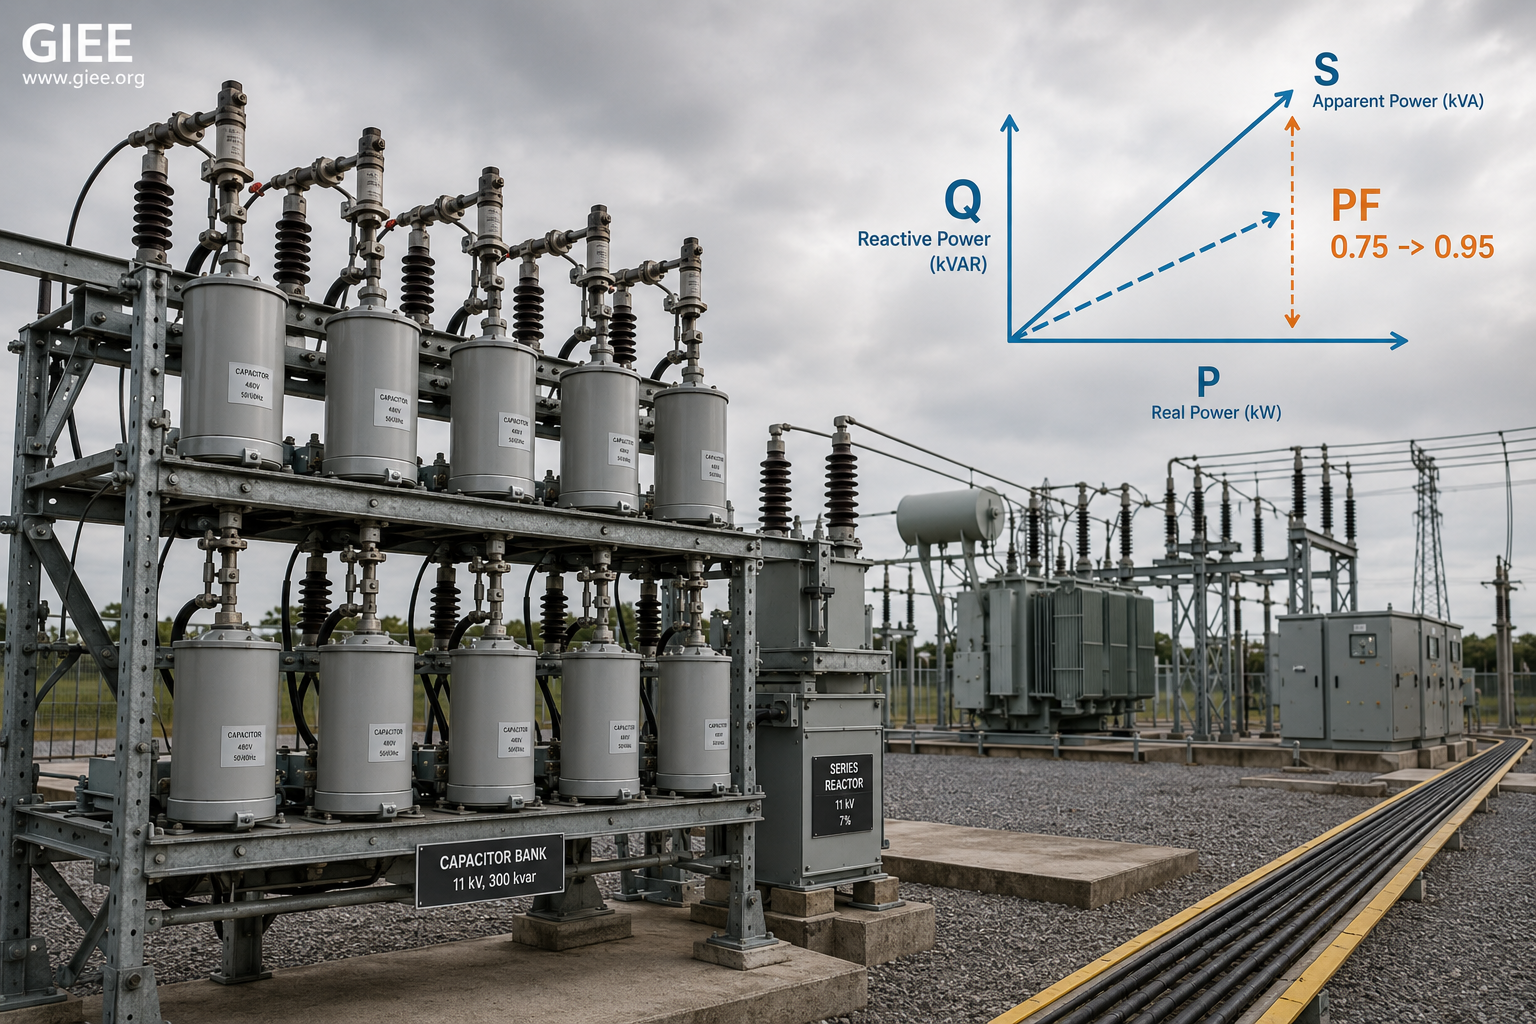
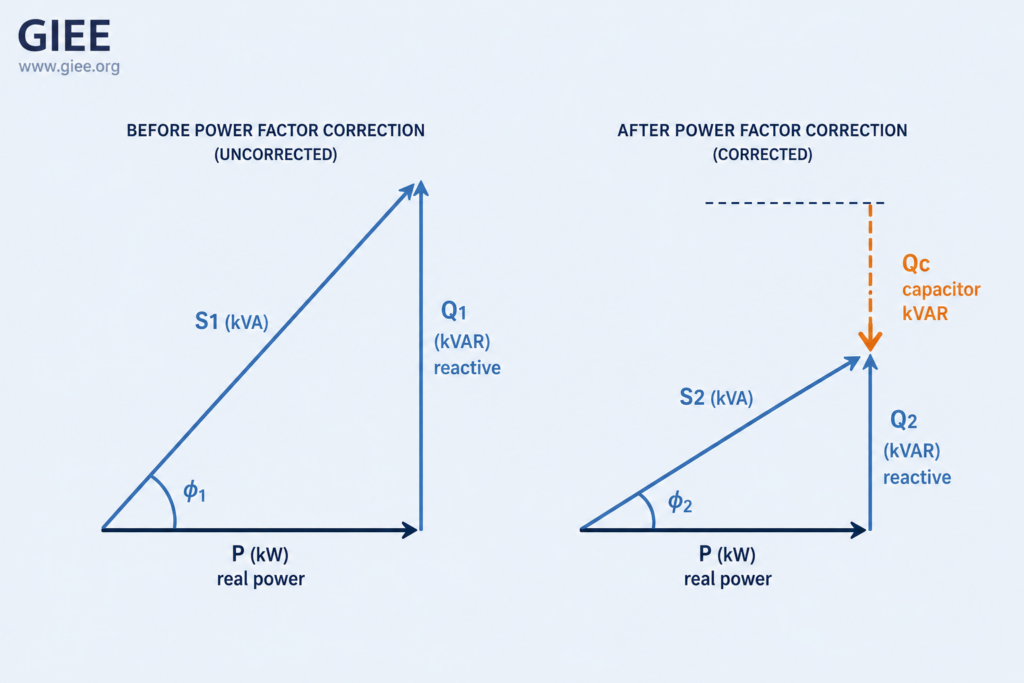
The relationship is captured by the power triangle, where apparent power is the vector sum of real and reactive power.
Adding capacitance reduces the net reactive power Q the source has to supply. Because P stays the same, shrinking Q shortens the hypotenuse S and raises the power factor. The reactive output a bank must supply to move a load from an initial angle φ₁ to a target angle φ₂ follows directly:
Q_c = P × (tan φ1 - tan φ2) [reactive power to be supplied, kVAR]
Current Reduction
Line current in a three-phase system depends on apparent power, not real power. For a balanced load, current is the apparent power divided by the line voltage and the √3 factor. Because raising the power factor reduces apparent power for the same real load, the current the supply must carry falls in direct proportion.
I = P / (√3 × V_LL × PF) [three-phase line current, A]
Consider a common industrial case. A plant draws a real load of 500 kW at 480 V three-phase, but its banks of induction motors leave it running at a power factor of 0.75 lagging. At that power factor the line current is high. Correcting to 0.95 with a properly sized capacitor bank cuts the apparent power, and the current drops with it.
Loss Reduction
Resistive losses in conductors, transformer windings, and switchgear scale with the square of the current: P_loss = I²R. Because losses follow the square of current, even a modest current reduction produces a larger loss reduction. In the example above, current fell from 802 A to 633 A, a ratio of 0.79. Squaring that ratio gives 0.62, so the I²R losses in the feeder serving that load drop to about 62% of their previous value – a reduction of nearly 38%.
This is the part of the benefit that engineers most often undervalue. The current reduction looks linear and unremarkable, but the loss reduction is quadratic and significant, and it accrues every hour the plant runs. On a heavily loaded distribution feeder, well-placed shunt capacitors can recover a meaningful share of annual feeder losses, which is why utilities deploy switched capacitor banks as a standard loss-reduction and capacity-deferral measure.
Correcting power factor from 0.75 to 0.95 on the example load cuts feeder I²R losses by about 38%, because loss scales with the square of current and current falls 21%.
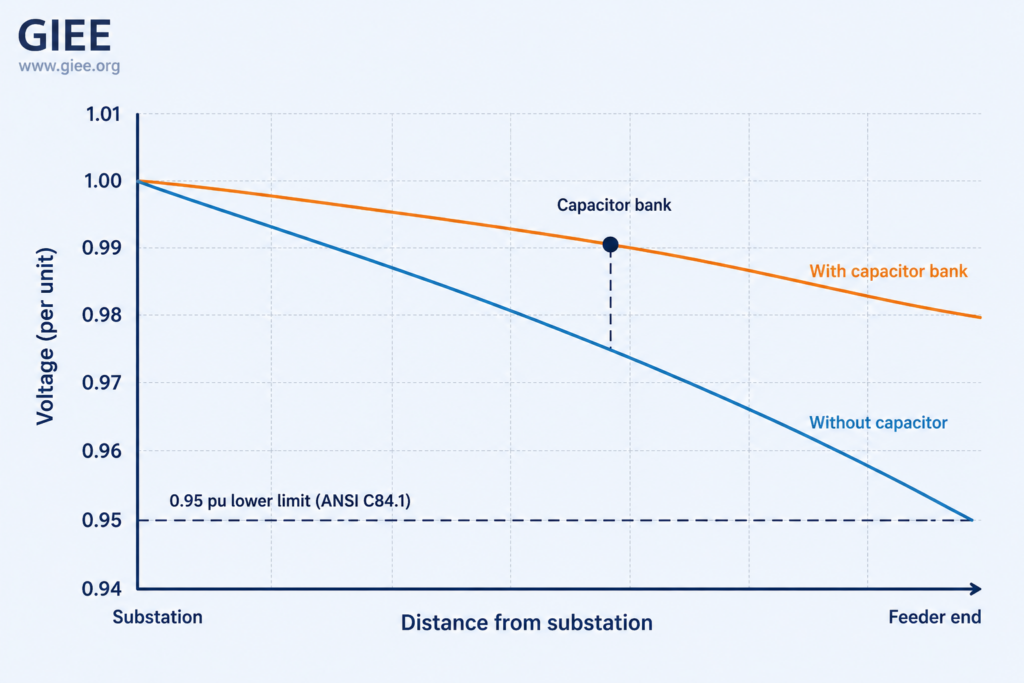
Voltage Profile Improvement
The third benefit is a flatter voltage profile along the line. The approximate voltage drop across a feeder of resistance R and reactance X depends on both the real and the reactive power flowing through it.
On distribution and subtransmission lines the reactance X is usually larger than the resistance R, so the reactive term Q×X often dominates the voltage drop. When a shunt capacitor cancels reactive power flow, it removes a large share of that drop. The result is a voltage boost at the point of connection and a flatter profile from the substation to the feeder end. Utilities use this deliberately: switched capacitor banks turn on during peak load to hold end-of-feeder voltage within the ANSI C84.1 service range, and switch off at light load to avoid pushing voltage too high.
The same physics applies inside an industrial facility. A motor starting across the line draws a large lagging current, and the resulting reactive drop can sag the bus enough to disturb sensitive equipment. A capacitor bank near the load stiffens the bus by supplying reactive current locally instead of pulling it through the upstream impedance.
Where the Banks Go: Plants, Motors, and Feeders
The placement of a capacitor bank determines how much of the network sees the benefit. The general rule is that compensation helps everything upstream of where it is installed, so the closer the bank sits to the inductive load, the more conductor and equipment capacity it frees.
| Application | Typical placement | Primary benefit |
|---|---|---|
| Industrial plant | Switched bank at the main bus or MCC | Avoids utility PF penalty, frees transformer kVA |
| Large motor loads | Fixed capacitors at motor terminals | Cuts feeder current, stiffens bus during operation |
| Distribution feeder | Pole-mounted switched banks along the line | Voltage support and loss reduction at peak |
For motor loads there is an important constraint: a fixed capacitor connected directly at a motor’s terminals must be sized below the motor’s no-load magnetizing kVAR. Oversizing risks self-excitation, where the spinning motor, disconnected from the supply, feeds itself from the capacitor and sustains a dangerous overvoltage. Plant-level switched banks with automatic controllers avoid this by responding to the aggregate load rather than a single machine.
Standards and Practical Selection
Capacitor units and banks are governed by a small set of well-established standards. IEEE Std 18-2012 defines the ratings and test requirements for shunt power capacitors, IEEE Std 1036 is the application guide for shunt capacitors, and IEC 60871 is the international counterpart for systems above 1000 V. In the United States, NEC Article 460 covers the installation, conductor sizing, and overcurrent and discharge requirements for capacitors in the field. Designing to these documents keeps a bank within its thermal and dielectric limits and ensures the discharge resistors bleed off stored charge safely after disconnection.
The practical selection sequence is consistent across applications: measure the existing power factor and load profile, decide whether fixed or switched compensation fits the load variability, calculate the kVAR from the power-triangle relationship, check for harmonic resonance, and verify the result against the governing standards. Skipping the harmonic check is the single most common path to a premature bank failure.
Conclusion
Capacitor banks remain one of the highest-return interventions available to a power engineer because a single, well-sized device improves three things at once: it cuts line current in proportion to the power factor gain, it cuts I²R losses by the square of that current reduction, and it lifts and flattens the voltage profile by removing reactive flow from a reactance-dominated line. The physics is simple, but the application discipline – correct sizing, deliberate placement near the inductive load, and a harmonic resonance check – is what separates a reliable installation from a costly failure. If you are working through interconnection and feeder voltage analysis, see our companion GIEE guides on hosting capacity analysis and distribution voltage management to put these calculations into a full study workflow.