Key Takeaways
- Energy storage has moved from a niche grid asset to critical infrastructure, driven by falling lithium-ion costs (average pack prices near $115/kWh in 2024) and rising shares of inverter-based renewables.
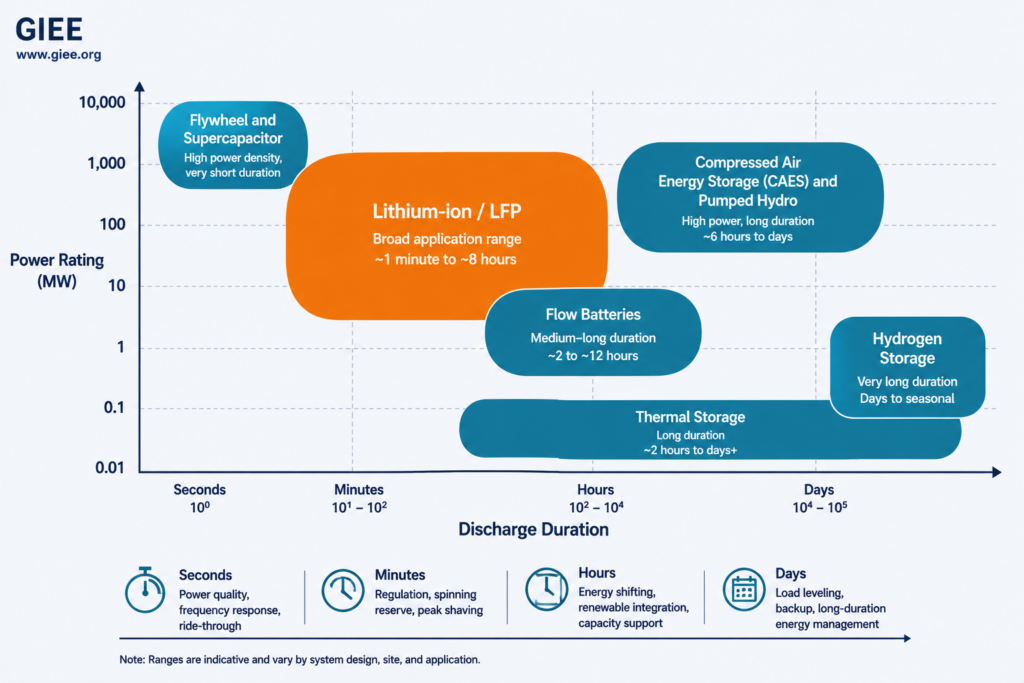
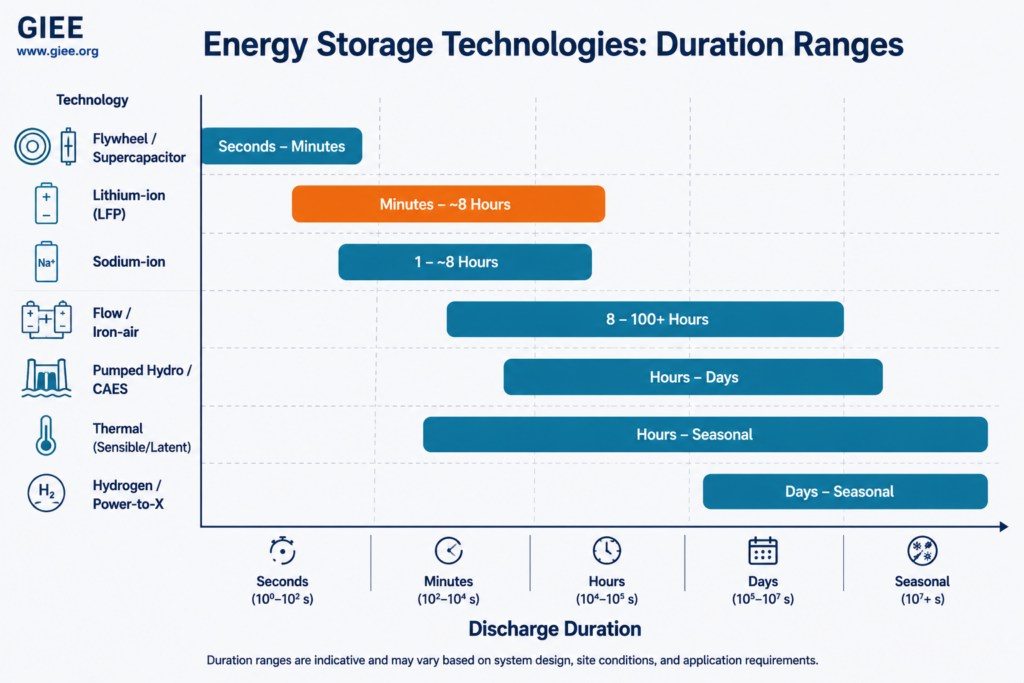
- Two parameters define every storage decision: power rating (MW, how fast you can move energy) and energy capacity (MWh, how much you can store). Their ratio, the duration, governs which technology fits.
- No single technology wins everywhere. Lithium-ion (especially LFP) dominates 1–8 hour applications; pumped hydro still holds roughly 90% of global installed capacity; flow, thermal, hydrogen and iron-air target longer durations.
- Safe, code-compliant design hinges on a stack of standards – IEC 62933, IEC 62619, UL 9540, UL 9540A and NFPA 855 – and on disciplined thermal management and fire detection to manage thermal runaway risk.
- Sound engineering economics depend on round-trip efficiency, usable depth of discharge, cycle and calendar life, and augmentation strategy, not on nameplate capacity alone.
1. Introduction: Why Storage Became Critical Infrastructure
For most of the twentieth century, electric power systems were built on a simple premise: generation followed load in real time, and the grid stored almost nothing. Energy storage existed, but it was concentrated almost entirely in pumped hydro plants sited where geography allowed. That premise is now breaking down. As inverter-based resources (IBR) such as solar PV and wind displace synchronous thermal generation, the system needs a way to decouple when energy is produced from when it is consumed – and to provide the fast, controllable response that retiring synchronous machines once supplied for free.
Energy storage is the technology that closes that gap. A storage asset can absorb surplus solar at midday and release it into the evening peak, ride through a transmission contingency in milliseconds, regulate frequency second-by-second, and firm a variable wind plant into a dispatchable resource. Few other technologies serve so many roles from the same hardware.
The commercial inflection point arrived when costs fell far enough that storage became the default answer to problems that previously required new peaking plants or transmission. Lithium-ion battery pack prices fell from well above $1,000/kWh in 2010 to an average near $115/kWh in 2024 [BloombergNEF Battery Price Survey 2024]. At that price, four-hour battery systems out-compete new gas peakers across a growing share of US and international markets, and developers now routinely pair storage with new solar and wind as a matter of course rather than as an exception.
Global battery storage deployment has grown more than tenfold since 2018, with annual additions now measured in hundreds of GWh. China, the United States and Europe account for the large majority of grid-scale installations. [Figures move quickly – verify against the latest IEA and BloombergNEF data before publication.]
This guide is written for the working engineer who has to specify, evaluate, or simply understand these systems. It moves from first principles through technology selection, sizing calculations, and the safety and standards framework that governs real deployments. The aim is practitioner-grade depth delivered without unnecessary derivation – enough to support real decisions on your next interconnection study, RFP evaluation, or feasibility assessment.
2. Fundamentals of Energy Storage Systems
What an ESS Actually Is
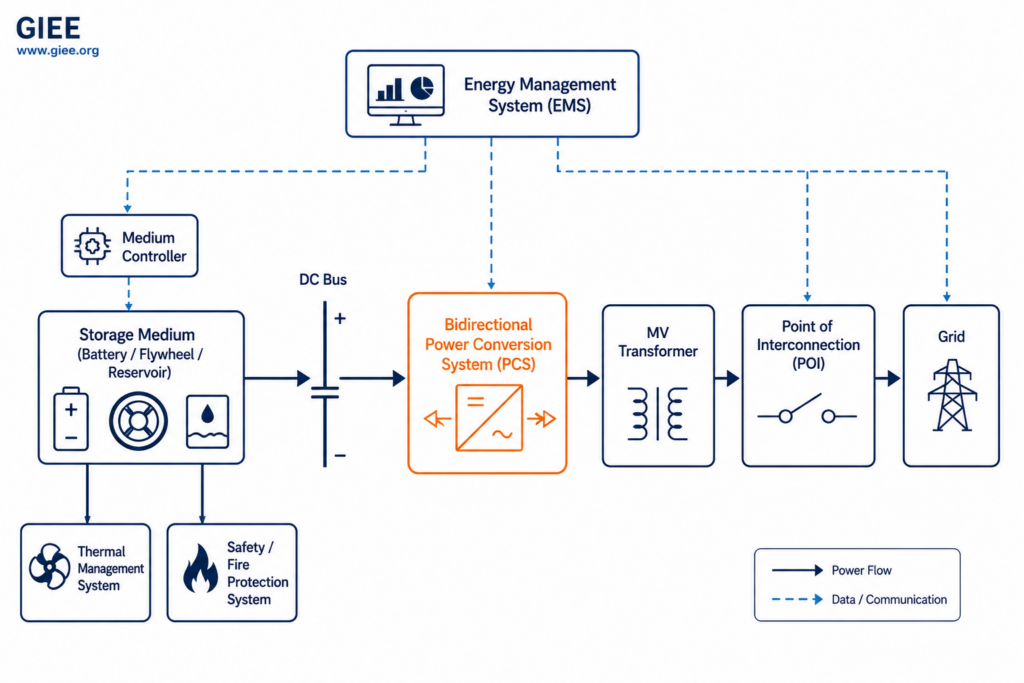
An energy storage system (ESS) is an integrated assembly that converts electrical energy into a storable form, holds it with acceptable losses, and converts it back to electricity on demand. The defining word is system: a storage asset is never just a battery or a reservoir. It is the storage medium plus the power conversion, control, protection, thermal management, and safety subsystems that make the medium safe and dispatchable.
Charging and Discharging Principles
Every ESS operates on the same conceptual cycle. During charging, electrical energy from the grid or a generation source is converted into the storage medium’s native form: chemical potential in a battery, gravitational potential in pumped hydro, kinetic energy in a flywheel, or thermal energy in a molten salt tank. During discharging, that stored energy is converted back into electricity and delivered to the load or grid. Each conversion incurs losses, which is why no storage system returns all the energy it absorbs.
For a battery, the cycle is electrochemical. On charge, an external voltage drives ions (lithium ions in a Li-ion cell) from the positive electrode through the electrolyte to the negative electrode, storing energy in the resulting chemical potential. On discharge, the ions migrate back, driving electrons through the external circuit to do work. The power conversion system (PCS) manages the DC-to-AC interface in both directions.
Energy versus Power: The Most Important Distinction
The single most common conceptual error in storage engineering is conflating energy and power. They are independent quantities, and confusing them produces undersized or mis-applied systems.
Power, rated in kilowatts or megawatts (kW, MW), is the rate at which the system can charge or discharge – how fast energy moves. It is set primarily by the power conversion system and the medium’s ability to source or sink that rate. Energy, rated in kilowatt-hours or megawatt-hours (kWh, MWh), is the total quantity the system can store – how much it holds. It is set by the size of the storage medium.
Their ratio is the storage duration:
A flywheel and a vanadium flow battery sit at opposite ends of this spectrum. The flywheel is a high-power, low-energy device – enormous instantaneous power for seconds to minutes. The flow battery is a high-energy, lower-power device – modest power sustained for many hours. Choosing between technologies begins with placing your application on this energy-versus-power map.
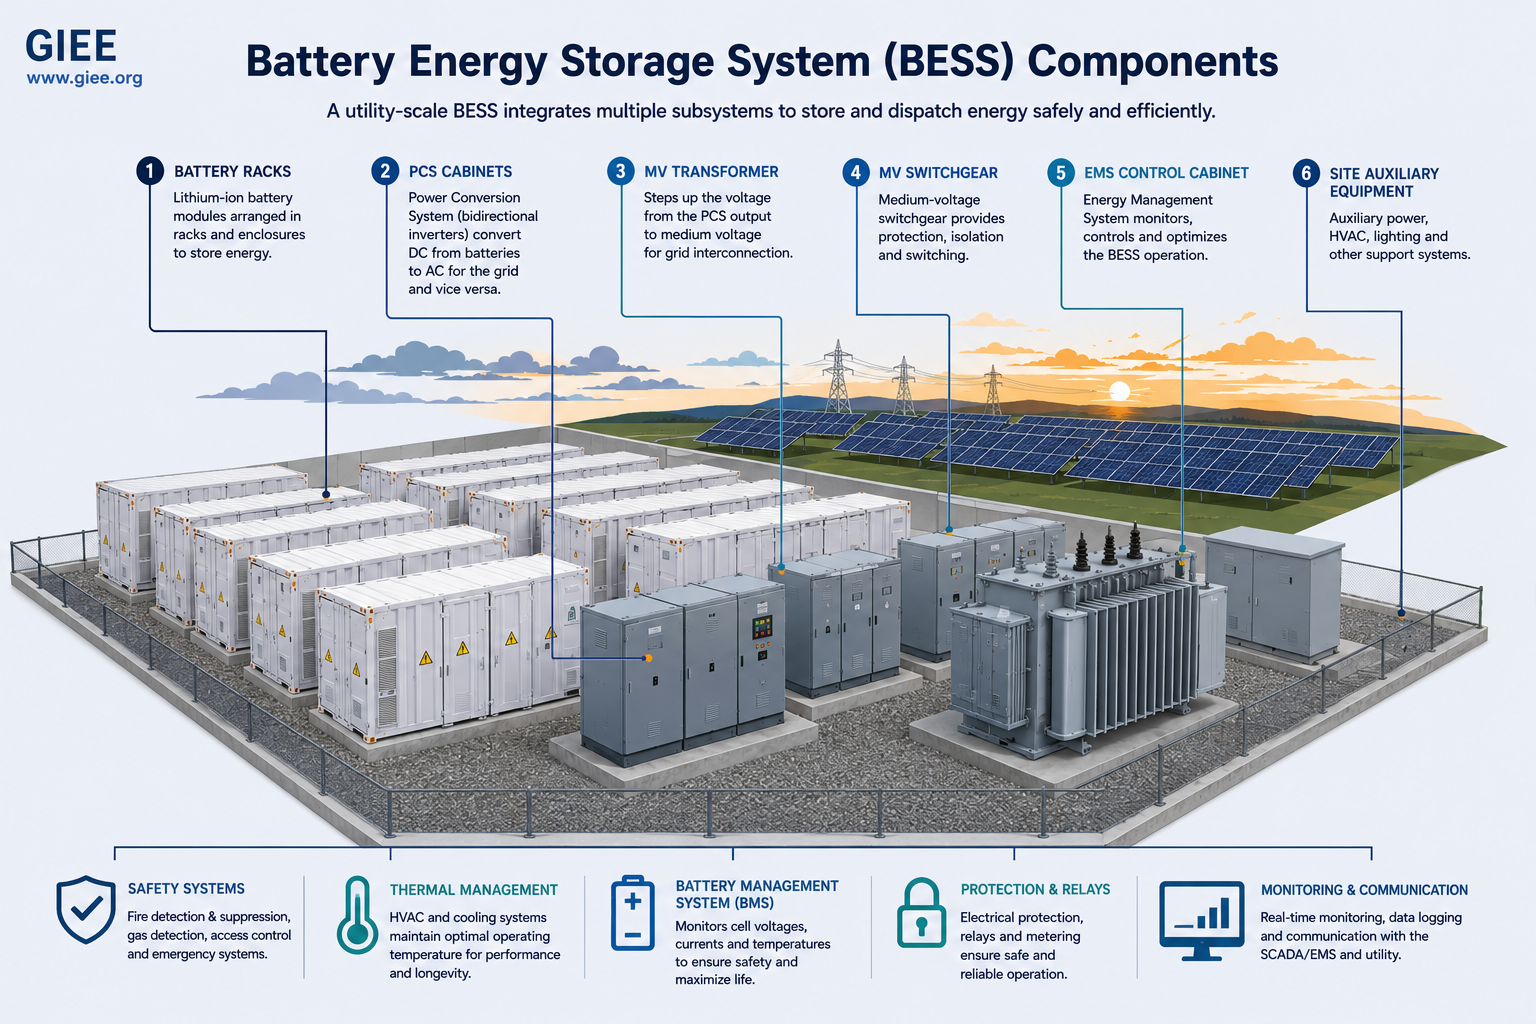
Key Components of an Energy Storage System
While media differ, most electrical storage systems share a common functional architecture:
- Storage medium – the battery cells, water reservoir, flywheel rotor, salt tank, or hydrogen vessel that physically holds the energy.
- Power conversion system (PCS) – bidirectional inverters/rectifiers that convert between the medium’s native form and grid-compatible AC, controlling power flow and grid-interactive behaviour.
- Control and energy management system (EMS) – the supervisory layer that decides when and how much to charge or discharge based on market signals, grid services, or local needs.
- Balance of plant – transformers, switchgear, protection, auxiliary power, and the medium-voltage interconnection to the point of common coupling.
- Thermal management – heating, cooling, and ventilation to keep the medium within its safe and efficient operating window.
- Safety and protection systems – gas/smoke detection, fire suppression, deflagration management, and electrical protection.
3. Why Energy Storage Is Needed
Storage earns its place by solving a set of distinct engineering and economic problems. The same physical asset often provides several of these services – a practice called value stacking – but each is worth understanding on its own.
Managing Renewable Intermittency
Solar and wind output is variable and partly unpredictable. A passing cloud field can drop a PV plant’s output by tens of percent in seconds; wind ramps over minutes to hours. Storage smooths these fluctuations, absorbing surplus and releasing it when generation falls, so that a variable resource presents a firmer, more dispatchable profile to the grid.
Grid Stability and Frequency Regulation
System frequency must be held tightly around its nominal value (50 Hz or 60 Hz). As synchronous generators retire, the grid loses rotating inertia and the headroom for fast frequency response shrinks. Battery storage responds in milliseconds, far faster than any thermal unit, making it ideally suited to frequency regulation (responding to the automatic generation control signal) and fast frequency response after a generation trip. This was the headline service of the first large grid batteries.
Peak Shaving and Load Shifting
Peak shaving uses stored energy to reduce a facility’s or feeder’s maximum demand, deferring network upgrades and cutting demand charges. Load shifting (energy arbitrage’s behind-the-meter cousin) moves consumption in time – charging when energy is cheap and abundant, discharging when it is expensive or constrained. Both convert a peaky, expensive load profile into a flatter, cheaper one.
Energy Arbitrage
In wholesale markets, arbitrage means buying energy when locational marginal prices are low (often midday solar troughs) and selling when they are high (evening peaks). The economics depend on the spread between low and high prices, the system’s round-trip efficiency, and degradation cost per cycle. As solar penetration deepens and midday prices fall, the arbitrage spread – and the value of storage – tends to widen.
Backup Power and Black Start
For critical loads, storage provides ride-through and backup during outages, increasingly displacing diesel gensets where run-times are short. At system scale, suitably equipped storage can provide black start capability – energising a portion of the grid from a fully de-energised state after a blackout, a service traditionally provided by hydro and specialised gas units.
4. Key Performance Parameters
Storage systems are specified and compared using a consistent set of parameters. Understanding each – and how they interact – is the foundation of every sizing calculation and procurement decision.
Energy Capacity and Power Rating
Energy capacity (kWh, MWh) is the total energy the system can store, usually quoted at beginning of life. Power rating (kW, MW) is the maximum continuous charge/discharge rate. As covered above, their ratio is the duration. Note that nameplate energy and usable energy differ once depth of discharge and degradation are applied.
Round-Trip Efficiency (RTE)
Round-trip efficiency is the fraction of energy put in that comes back out over a full charge-discharge cycle. It captures all conversion and auxiliary losses, including PCS, transformer, and parasitic loads such as cooling.
Typical AC-to-AC system round-trip efficiencies: lithium-ion 85–92%, lead-acid 75–85%, vanadium flow 65–80%, pumped hydro 70–80%, hydrogen power-to-power roughly 30–45%. Always confirm whether a quoted figure is DC (cell-level) or AC (system-level) – the difference is material.
State of Charge and State of Health
State of charge (SoC) is the present energy content as a percentage of usable capacity – the storage analogue of a fuel gauge. State of health (SoH) is the present maximum capacity as a percentage of beginning-of-life capacity; it quantifies degradation. An asset might operate at 60% SoC while having a SoH of 90% after several years of cycling.
Depth of Discharge and Cycle Life
Depth of discharge (DoD) is how much of the capacity is used in a cycle (100% DoD means fully discharged). Cycle life is the number of charge-discharge cycles before capacity falls below a defined threshold (commonly 80% of rated). These two are coupled: deeper cycling generally shortens cycle life, which is why operating windows are deliberately constrained.
Calendar Life, Response Time, and Density
Calendar life is the time-based degradation that occurs whether or not the system cycles, driven by temperature and average SoC. A battery might be rated for, say, 6,000 cycles or 15 years calendar life – whichever comes first. Response time is how quickly the system can go from idle to full output; for batteries and flywheels this is milliseconds, for pumped hydro and CAES it is seconds to minutes. Energy density (Wh/kg or Wh/L) and power density (W/kg) describe how much energy or power is packed per unit mass or volume – decisive for mobile applications and for footprint-constrained sites.
5. Classification of Energy Storage Technologies
Storage technologies are grouped by the physical form in which they hold energy: electrochemical, mechanical, thermal, and chemical. Each family occupies a characteristic region of the power-duration-cost space.
Electrochemical Storage
Lithium-ion batteries are the workhorse of modern storage. They offer high round-trip efficiency, high energy and power density, fast response, and steeply falling costs. “Lithium-ion” is a family, not a single chemistry, and the cathode choice drives the trade-offs:
- LFP (lithium iron phosphate, LiFePO₄) – now dominant in stationary storage. Lower energy density than NMC, but superior cycle life (commonly 4,000–10,000+ cycles), better thermal stability (higher thermal runaway onset temperature, around 250–270 °C), lower cost, and no cobalt. The default chemistry for new grid projects.
- NMC (nickel manganese cobalt) – higher energy density, favoured where mass and volume matter (electric vehicles, footprint-constrained sites). Lower thermal runaway onset (around 200–210 °C) and higher cost per cycle make it less common in new stationary builds.
Lead-acid batteries are the oldest commercial rechargeable chemistry. They are cheap, robust, and fully recyclable, but suffer low energy density (around 30–50 Wh/kg), limited cycle life (often 500–1,500 cycles), and poor performance at deep discharge. Their role in grid storage is now largely confined to backup and small off-grid systems.
Sodium-ion batteries are an emerging alternative that swaps lithium for abundant sodium. They promise lower material cost and supply-chain resilience, strong cold-weather performance, and good safety, at the price of lower energy density today. Commercial stationary deployments began scaling in the mid-2020s and the chemistry is one to watch closely.
Flow batteries store energy in liquid electrolytes held in external tanks, pumped through a cell stack. The defining feature is that power (stack size) and energy (tank size) are decoupled and independently scalable – ideal for long-duration applications. Vanadium redox is the most mature; round-trip efficiency is modest (65–80%), but cycle life is very long (often 15,000–20,000+ cycles) with little capacity fade, and the electrolyte does not degrade.
Mechanical Storage
Pumped hydro storage (PHS) remains, by a wide margin, the largest form of grid storage in the world – roughly 90% of installed global energy storage capacity. Surplus electricity pumps water from a lower to an upper reservoir; releasing it back through turbines regenerates electricity. Round-trip efficiency is 70–80%, asset life exceeds half a century, and individual plants reach the gigawatt scale. The constraint is geography: suitable sites with the necessary head and water are limited.
Flywheel energy storage holds kinetic energy in a high-speed rotor in a vacuum enclosure. It excels at high power, very fast response, and effectively unlimited cycling, but stores little energy and self-discharges quickly, so it serves short-duration, high-cycle services such as frequency regulation rather than bulk energy shifting.
Compressed air energy storage (CAES) compresses air into an underground cavern when energy is cheap, then expands it through a turbine to regenerate power. Conventional (diabatic) CAES burns some natural gas during expansion, giving a power-to-power efficiency around 42–54%; advanced adiabatic designs that capture and reuse the heat of compression target higher efficiencies. Like PHS, it depends on suitable geology.
Thermal Storage
Thermal energy storage holds energy as heat (or cold) for later use as heat or for conversion back to electricity.
- Sensible heat storage raises the temperature of a medium (water, rock, concrete, molten salt) without phase change. Simple and cheap; the most widely deployed thermal approach.
- Latent heat storage uses the heat absorbed or released during a phase change (typically solid-to-liquid) in a phase-change material, storing more energy per unit mass over a narrow temperature band.
- Molten salt storage is the workhorse of concentrating solar power (CSP), storing high-temperature heat (often 290–565 °C) to drive a steam turbine after sunset, extending a solar thermal plant’s output into the evening.
Chemical Storage
Hydrogen energy storage uses surplus electricity to split water by electrolysis, producing hydrogen that can be stored for days, weeks, or seasons and later reconverted to electricity in a fuel cell or turbine, or used directly as a fuel or feedstock. The strength is very long-duration and large-scale storage; the weakness is low round-trip efficiency (roughly 30–45% power-to-power) due to losses at every conversion. Power-to-gas (P2G) extends this by converting hydrogen (optionally with captured CO₂) into synthetic methane that can use existing gas infrastructure.
6. Battery Energy Storage Systems (BESS)
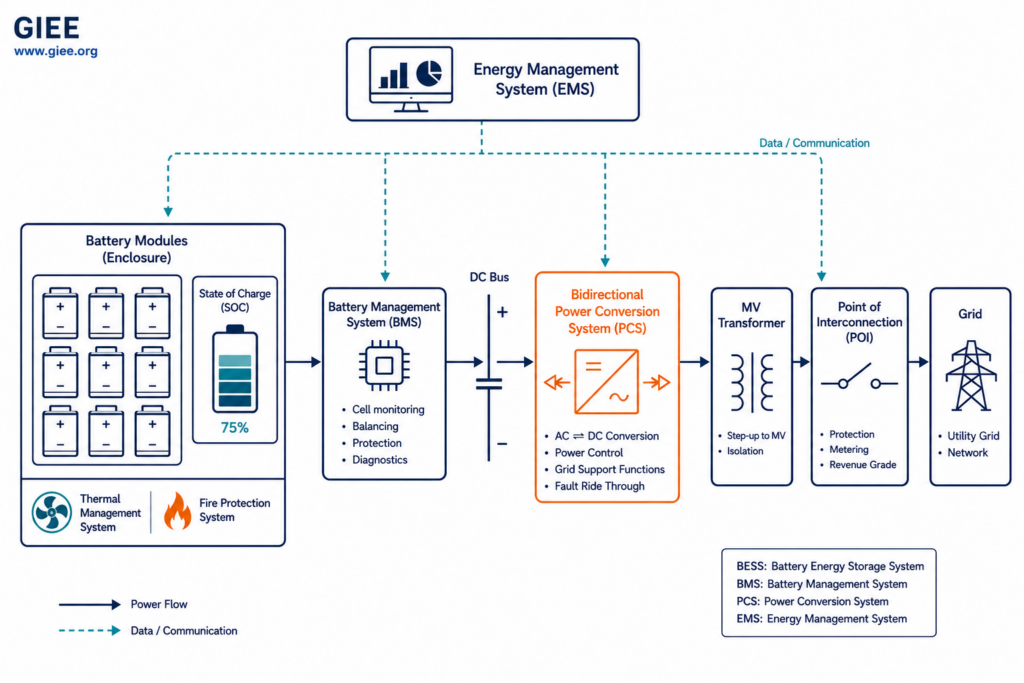
Because lithium-ion BESS dominates new grid-scale deployment, it deserves a detailed structural treatment. A BESS is a hierarchy, built up from the electrochemical cell to the integrated, grid-connected plant.
From Cell to Plant: The Physical Hierarchy
- Battery cell – the fundamental electrochemical unit (a single LFP or NMC cell), typically a few volts. The cell is where energy is actually stored.
- Battery module – cells connected in series and parallel and packaged together with sensing and mechanical support, raising voltage and capacity to a manageable building block.
- Battery pack – multiple modules assembled with module-level controls.
- Battery rack (or string) – packs/modules stacked and connected in series to reach the DC bus voltage (often around 1,000–1,500 V DC), the unit that connects to the PCS.
- Enclosure / container – multiple racks integrated with thermal management, fire protection, and controls into a containerised or modular building block, then replicated across the site to reach the project’s MW and MWh.
Battery Management System (BMS)
The battery management system is the safety- and performance-critical brain at the cell and rack level. It monitors cell voltages, currents, and temperatures; estimates SoC and SoH; performs cell balancing so that cells age evenly; and enforces protective limits, disconnecting the battery if any parameter strays outside safe bounds. A BESS is only as safe as its BMS; poor cell monitoring is a direct path to thermal events.
Power Conversion System (PCS)
The power conversion system is the bidirectional inverter that converts DC battery power to grid AC on discharge and AC to DC on charge. It sets the power rating and governs grid-interactive behaviour – voltage and frequency ride-through, reactive power support, and increasingly grid-forming operation. Under IEEE 1547-2018, the PCS must meet defined response requirements for abnormal voltage and frequency conditions, making it central to interconnection compliance.
Energy Management System (EMS)
The energy management system is the supervisory controller that decides the asset’s dispatch: when to charge, when to discharge, and how to allocate capacity across services. It integrates market signals, grid-operator instructions, generation forecasts, and the battery’s own state to optimise revenue and respect operating constraints. The EMS sits above the PCS and BMS and is where value-stacking logic lives.
Thermal Management and Fire Protection
Lithium-ion cells perform and age best within a narrow temperature band (roughly 15–35 °C). Thermal management – air cooling in older designs, liquid cooling in most modern utility systems – holds cells in that window, improving life and safety. Fire protection is a layered system: gas and smoke detection for early off-gassing, ventilation and deflagration management to prevent explosive accumulation, and suppression. UL 9540A test data informs spacing, enclosure design, and the emergency response plan. These systems are not optional add-ons; they are integral to a code-compliant design.
7. Comparison of Battery Technologies
The table below summarises the practical trade-offs between the major battery chemistries used in or considered for stationary storage. Values are representative ranges; specific products vary and figures move with each product generation – confirm against current datasheets before design.
| Chemistry | RTE (system) | Energy Density | Cycle Life | Relative Safety | Relative Cost |
|---|---|---|---|---|---|
| Li-ion LFP | 85–92% | 90–160 Wh/kg | 4,000–10,000+ | High | Low–Moderate |
| Li-ion NMC | 90–95% | 150–250 Wh/kg | 1,500–4,000 | Moderate | Moderate |
| Lead-acid | 75–85% | 30–50 Wh/kg | 500–1,500 | High | Very Low |
| Sodium-ion | 85–92% | 75–160 Wh/kg | 2,000–5,000+ | High | Low (target) |
| Vanadium flow | 65–80% | 15–25 Wh/kg | 15,000–20,000+ | Very High | High (capex) |
The reading is straightforward: LFP wins the broad middle of stationary applications on the combination of cost, cycle life, and safety; NMC holds where density matters; lead-acid survives in low-cost backup roles; sodium-ion is the cost-and-supply challenger to watch; and vanadium flow is the long-duration specialist where its very long cycle life amortises its higher capital cost.
| Chemistry | Best-fit duration | Typical applications |
|---|---|---|
| Li-ion LFP | 1–8 h | Grid-scale arbitrage, peak shaving, solar-plus-storage, C&I |
| Li-ion NMC | 0.5–4 h | EVs, footprint-limited sites, fast response |
| Lead-acid | minutes–hours | UPS, backup, small off-grid |
| Sodium-ion | 1–6 h | Grid storage, cold climates, cost-sensitive projects |
| Vanadium flow | 4–12+ h | Long-duration shifting, high-cycle daily use |
8. Mechanical Energy Storage Technologies
Mechanical storage converts electricity into potential or kinetic energy and back. These technologies dominate at large scale and long duration where their durability and low energy-related cost outweigh slower response.
Pumped Hydro Storage
Operating principle: two reservoirs at different elevations; pump water up to store, release through turbines to generate. Advantages: very large energy capacity, asset life of 50–80+ years, mature and bankable, low cost per stored MWh. Disadvantages: geographically constrained, long permitting and construction timelines, high upfront capital, and environmental/water considerations. Real-world example: the Bath County Pumped Storage Station in Virginia, USA, rated around 3 GW, is among the largest energy storage facilities in the world and has operated since the 1980s.
Flywheel Energy Storage
Operating principle: a motor-generator spins a rotor to high speed in a low-friction vacuum; energy is stored as rotational kinetic energy and recovered by slowing the rotor. Advantages: millisecond response, extremely high cycle life (hundreds of thousands to millions of cycles), no chemical degradation. Disadvantages: low energy capacity and high self-discharge make it unsuitable for energy shifting. Real-world example: flywheel plants have provided fast frequency regulation in markets such as PJM in the United States, exploiting their speed and cycling durability.
Compressed Air Energy Storage (CAES)
Operating principle: compress air into an underground cavern when power is cheap; expand it through a turbine (with or without supplemental heat) to regenerate electricity. Advantages: large scale, long life, hours of duration. Disadvantages: geological dependence, lower efficiency in diabatic designs, supplemental fuel use in conventional plants. Real-world examples: the Huntorf plant in Germany (commissioned 1978, around 290 MW) and the McIntosh plant in Alabama, USA (1991, around 110 MW) are the long-running reference installations; advanced adiabatic and isothermal concepts aim to raise efficiency and remove fuel use.
9. Thermal Energy Storage
Thermal energy storage (TES) holds energy as heat or cold, often at far lower cost per kWh than electrochemical storage when the end use is itself thermal.
Industrial Applications
Industry consumes vast quantities of process heat. TES lets a facility decouple heat generation from heat demand – storing heat produced with cheap or surplus electricity (or recovered waste heat) for use during peak periods. Emerging high-temperature “thermal battery” concepts heat refractory bricks or particles to very high temperatures with renewable electricity, then release that heat on demand, targeting hard-to-electrify industrial processes.
Solar Thermal Power Plants
Concentrating solar power (CSP) plants are the flagship TES application. Mirrors focus sunlight to heat a fluid; molten salt stores the resulting high-temperature heat so the plant can generate electricity for hours after sunset. Real-world example: CSP towers with molten-salt storage, such as facilities in Spain, the United States, and the Middle East, have demonstrated multi-hour dispatchable solar generation, with some designs storing 8–15 hours of capacity.
District Heating and Long-Duration Opportunities
In district heating systems, large hot-water tanks or even seasonal underground thermal stores shift heat from summer to winter. Because heat is cheap to store in bulk, TES is among the most economical routes to genuinely long-duration (seasonal) storage where the demand is thermal rather than electrical.
10. Hydrogen and Chemical Storage
Chemical storage holds energy in molecular bonds, offering the highest energy density and the longest practical storage durations of any approach – at the cost of low round-trip efficiency.
Electrolysis and Green Hydrogen
Electrolysis uses electricity to split water into hydrogen and oxygen, in alkaline, proton-exchange-membrane (PEM), or solid-oxide electrolysers. When the electricity comes from renewables, the product is green hydrogen. Electrolyser efficiency is typically 60–75% on a lower-heating-value basis, and this is only the first of several conversion losses in a power-to-power chain.
Storage Methods and Fuel Cells
Hydrogen can be stored as a compressed gas, as a cryogenic liquid, or in underground salt caverns for very large volumes. To regenerate electricity, a fuel cell recombines hydrogen with oxygen, producing electricity and water with no combustion. The full power-to-power round trip – electrolysis, storage, then fuel cell – lands around 30–45% efficiency, which is why hydrogen targets long-duration and seasonal roles rather than daily cycling, where batteries are far more efficient.
Power-to-X Applications
Power-to-X (P2X) describes converting surplus renewable electricity into hydrogen and then into other energy carriers or feedstocks: synthetic methane (power-to-gas), ammonia, methanol, or fuels for hard-to-decarbonise sectors such as shipping, aviation, and heavy industry. The value of P2X is less in returning electricity to the grid and more in decarbonising sectors that cannot easily electrify directly.
Cross-Family Technology Comparison
Before turning to applications, the table below places all four storage families side by side. It is the high-level map engineers use to shortlist candidate technologies before detailed design.
| Technology | RTE | Typical duration | Response time | Lifetime | Maturity |
|---|---|---|---|---|---|
| Lithium-ion (LFP/NMC) | 85–95% | 0.5–8 h | milliseconds | 10–20 yr | Commercial |
| Flow battery (vanadium) | 65–80% | 4–12+ h | seconds | 15–25 yr | Early commercial |
| Pumped hydro | 70–80% | 6–24+ h | seconds–minutes | 50–80+ yr | Mature |
| Flywheel | 85–90% | seconds–minutes | milliseconds | 20+ yr | Commercial (niche) |
| Compressed air (CAES) | 42–70% | hours–days | minutes | 30–40+ yr | Demonstrated |
| Thermal (molten salt) | varies (heat) | hours–days | minutes | 25–30 yr | Commercial (CSP) |
| Hydrogen (power-to-power) | 30–45% | days–seasonal | seconds–minutes | varies | Emerging |
11. Real-World Applications and Case Studies
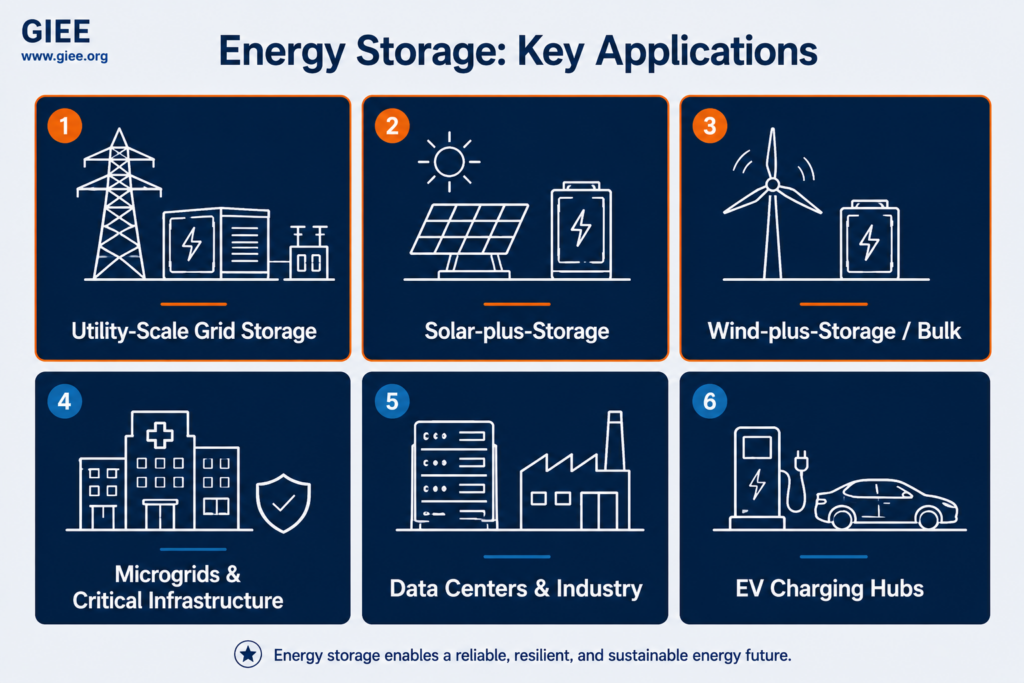
Storage now appears across every layer of the power system. The applications below, with representative real projects, illustrate how the technology earns its place in practice.
Utility-Scale Storage
Standalone grid batteries provide frequency regulation, capacity, and arbitrage at the transmission and distribution level. Case study – Hornsdale Power Reserve, South Australia: commissioned in 2017 (originally 100 MW / 129 MWh, later expanded to 150 MW / 193.5 MWh), this Tesla/Neoen project became the reference case for grid batteries. It demonstrated that a battery could provide frequency response faster and more cheaply than conventional plant, reportedly delivering substantial savings in frequency-control ancillary-service costs in its market and responding to generation trips within fractions of a second.
Solar-plus-Storage Projects
Pairing PV with batteries converts a daytime-only resource into one that serves the evening peak. Case study – Moss Landing, California, USA: one of the world’s largest battery installations, built in phases by Vistra and others at a former gas plant site, reaching multiple hundreds of MW and on the order of 3,000 MWh. It illustrates both the scale storage has reached and the importance of rigorous fire-safety engineering, after thermal incidents at the site underscored why UL 9540A testing, detection, and emergency planning are central to large lithium-ion deployments. [Verify current capacity and incident details against the operator’s latest disclosures before publication.]
Wind-plus-Storage and Bulk Storage
Storage firms variable wind output and shifts it to higher-value periods. At the bulk end, Case study – Bath County Pumped Storage, Virginia, USA: at roughly 3 GW it remains one of the largest storage facilities on Earth, providing many hours of dispatchable capacity and decades of reliable service – a reminder that pumped hydro still does the heavy lifting for bulk, long-duration grid storage even as batteries scale rapidly.
Microgrids and Critical Infrastructure
Microgrids combine local generation, storage, and controls to operate connected to or islanded from the main grid. Case study – resilience microgrids: facilities serving hospitals, military bases, and remote communities pair solar and batteries to ride through grid outages without relying solely on diesel. Island and remote-grid systems, such as battery-supported microgrids on Pacific and Caribbean islands, have displaced large shares of diesel generation while improving stability, demonstrating storage’s role where grid reliability is weakest.
Data Centers, Industry, and EV Charging
Data centers traditionally rely on lead-acid or lithium UPS for ride-through, but are increasingly adding larger batteries for peak management and grid services as their loads grow. Industrial facilities use storage for peak shaving and power quality. EV charging infrastructure is a fast-growing driver: high-power charging hubs use on-site batteries to buffer demand spikes, allowing them to connect to a weaker grid feed than their peak charging power would otherwise require – a clear example of storage substituting for network capacity.
12. Engineering Design Considerations
Selecting a storage technology and sizing it is a multi-objective decision. Experienced engineers work through a consistent set of factors rather than starting from a preferred technology.
Power, Energy, and Duration Requirements
Start by separating the power requirement (the peak MW the application demands) from the energy requirement (the MWh that must be delivered) and deriving the required duration. A frequency-regulation duty needs high power for short bursts; a daily arbitrage duty needs sustained energy over hours. The duration target is the single strongest filter on technology choice.
Site Conditions and Safety
Ambient temperature, available footprint, seismic and flood exposure, grid strength at the point of interconnection, and proximity to occupied buildings all constrain the design. Safety requirements – fire codes, setback distances, ventilation, and detection – flow from the chemistry and the site context, and increasingly drive layout as much as electrical considerations do.
Economics: CAPEX, OPEX, and Lifecycle
Capital cost (CAPEX) covers equipment, balance of plant, and installation. Operating cost (OPEX) covers maintenance, auxiliary energy, warranties, and – critically – augmentation, the periodic addition of capacity to offset degradation so the system meets its rated energy over its contract life. The right comparison metric is lifecycle cost, often expressed as levelized cost of storage (LCOS, $/MWh delivered), which folds efficiency, degradation, and replacement into a single figure.
Regulatory Requirements
Interconnection rules (IEEE 1547 in the US for distribution-connected resources), market participation rules, fire codes (NFPA 855), and product certifications (UL 9540) all shape what can be built and how. Regulatory review timelines frequently dominate project schedules, so engaging utilities and authorities having jurisdiction early is a practical necessity, not a formality.
13. Sample Engineering Calculations
The following worked examples show the core sizing and performance calculations every storage engineer should be able to perform. Numbers are illustrative; replace assumptions with project-specific values.
14. Safety and Industry Standards
Storage safety, particularly for lithium-ion, is an engineering discipline in its own right. The dominant hazard is thermal runaway, and the standards framework exists to prevent it, contain it, and manage its consequences.
Thermal Runaway
Thermal runaway is a self-sustaining exothermic chain reaction inside a cell: a trigger (overcharge, internal short, mechanical damage, or external heat) raises cell temperature, which accelerates further reactions, releasing more heat and flammable gases. Once started in one cell, heat can propagate to neighbours – cell-to-cell propagation – escalating into a module or enclosure fire. LFP chemistry has a higher onset temperature and is more tolerant than NMC, which is a major reason for its stationary dominance, but no lithium-ion chemistry is immune.
Fire Suppression and Safety Practices
Effective design is layered: early gas detection to catch off-gassing before flames appear; ventilation and deflagration management to prevent explosive accumulation of vented gases; physical spacing and barriers to limit propagation between enclosures; and suppression and emergency response planning developed with the local fire service. Crucially, lithium-ion fires are difficult to extinguish and can reignite, so the design emphasis is on prevention, containment, and safe burn-down rather than rapid extinguishment alone.
Grid Interconnection Considerations
On the electrical side, the PCS must satisfy interconnection requirements – voltage and frequency ride-through, anti-islanding, reactive-power capability, and protection coordination at the point of common coupling. IEEE 1547-2018 substantially tightened how inverter-based resources, including storage, respond to abnormal grid conditions, and compliance is now a gating item in distribution interconnection studies.
15. Challenges Facing Energy Storage Systems
For all its momentum, storage faces real constraints that engineers and planners must weigh honestly.
- Cost – though prices have fallen dramatically, capital cost still gates many long-duration and developing-market applications, and the economics depend on volatile commodity and market conditions.
- Raw material supply – lithium, nickel, cobalt, and graphite face concentrated supply chains and price volatility. This is a primary driver behind the shift to LFP and the interest in sodium-ion and iron-air, which use abundant materials.
- Recycling – end-of-life battery recycling is scaling but remains immature relative to the coming wave of retirements; recovering lithium economically is harder than recovering nickel and cobalt.
- Environmental concerns – mining impacts, water use, fire risk, and disposal all require management; lifecycle analysis matters as much as operational emissions.
- Grid integration – high penetrations of inverter-based storage and renewables reduce system inertia and raise protection, stability, and control challenges that grid-forming inverters and updated standards are still catching up to.
- Supply-chain and workforce – manufacturing capacity, interconnection queues, and a shortage of engineers experienced in storage design and commissioning all constrain how fast the industry can deploy.
16. The Future of Energy Storage (2025–2035)
The next decade will broaden the storage toolkit well beyond today’s lithium-ion plus pumped-hydro pairing. The most consequential developments to track:
New and Maturing Chemistries
Solid-state batteries replace the liquid electrolyte with a solid one, promising higher energy density and improved safety; they are progressing fastest toward electric-vehicle use, with stationary spillover to follow. Sodium-ion is moving from pilot to commercial scale, attractive for its abundant materials, cold-weather performance, and cost trajectory. Iron-air batteries, pioneered for multi-day (around 100-hour) storage at very low cost using iron and air, target the long-duration gap that lithium-ion cannot fill economically.
Long-Duration Energy Storage (LDES)
As renewable penetration deepens, the system needs storage measured in tens to hundreds of hours to cover multi-day lulls. This LDES category – spanning flow batteries, iron-air, advanced compressed air and gravity systems, thermal storage, and hydrogen – is where much of the innovation and policy support is now concentrated, because lithium-ion’s economics deteriorate sharply beyond roughly eight hours.
Smarter Control and New Grid Roles
AI-enabled energy management is moving from forecasting (load, price, and renewable output) into closed-loop dispatch optimisation, squeezing more value from existing assets through better-informed charge/discharge decisions. Vehicle-to-grid (V2G) would turn the enormous aggregate capacity of electric-vehicle batteries into a distributed grid resource, though it faces standardisation, battery-warranty, and market-design hurdles. And grid-forming inverters – which can establish voltage and frequency rather than merely following the grid – are increasingly paired with storage to provide synthetic inertia and stability services as synchronous generation retires, a capability that may prove as important as the energy storage itself.
17. Frequently Asked Questions
1. What is the difference between power and energy in a storage system?
Power (MW) is the rate of charge or discharge – how fast energy moves. Energy (MWh) is the total quantity stored – how much it holds. Their ratio is the duration. A 100 MW / 400 MWh system delivers 100 MW for 4 hours.
2. Why has LFP overtaken NMC for grid storage?
For stationary applications, footprint and energy density matter less than cost, cycle life, and safety. LFP offers longer cycle life, higher thermal-runaway onset temperature, lower cost, and no cobalt, which outweighs its lower energy density when the battery sits on the ground rather than in a vehicle.
3. How long do grid batteries last?
Modern LFP systems are commonly warranted for 10–20 years or several thousand cycles, whichever comes first. Capacity fades over time (state of health declines), so designs either over-size at the start or add capacity through augmentation to maintain rated energy across the contract.
4. What round-trip efficiency should I expect?
For a modern AC-connected lithium-ion system, expect 85–92% round-trip efficiency including PCS, transformer, and cooling losses. Always confirm whether a quoted figure is DC (cell-level) or AC (system-level) – the AC figure is what matters for project economics.
5. Is energy storage safe?
When engineered and operated to standards – UL 9540/9540A, IEC 62619, IEC 62933, NFPA 855 – lithium-ion storage has a strong safety record. The dominant hazard is thermal runaway, managed through chemistry choice (LFP), the battery management system, thermal management, gas/smoke detection, spacing, and emergency planning.
6. What is thermal runaway and how is it prevented?
It is a self-sustaining exothermic reaction inside a cell triggered by overcharge, short circuit, damage, or external heat. Prevention relies on a robust BMS that holds cells within safe limits, good thermal management, and chemistry selection; containment relies on cell spacing, detection, deflagration management, and suppression.
7. Can storage replace gas peaker plants?
For many short-to-medium duration peaking needs, yes – four-hour batteries already out-compete new gas peakers in a growing set of markets. For multi-day or seasonal reliability needs, lithium-ion alone is not yet economical, which is why long-duration technologies and, in some cases, firm dispatchable generation remain part of the mix.
8. What is augmentation and why does it matter?
Augmentation is the planned addition of battery capacity over a project’s life to offset degradation, so the system continues to meet its rated energy. It is a major operating-cost and design consideration: ignoring it leads to a system that quietly under-delivers as it ages.
9. How do I choose between storage technologies?
Start from the required duration and scale, then weigh site conditions, safety, and lifecycle cost (LCOS). Short, high-power duties favour flywheels or lithium-ion; 1–8 hour duties favour LFP; 8–100+ hour duties favour flow, iron-air, or thermal; bulk and seasonal needs favour pumped hydro, CAES, or hydrogen.
10. What role will hydrogen play in storage?
Hydrogen’s low round-trip efficiency (roughly 30–45%) rules it out for daily cycling, where batteries dominate. Its value lies in very long-duration and seasonal storage, and as a feedstock for hard-to-electrify sectors through power-to-X. It complements, rather than competes with, short-duration batteries.
18. Conclusion
Executive Summary
Energy storage has crossed the threshold from supporting technology to critical grid infrastructure. Falling lithium-ion costs, the retirement of synchronous generation, and the rising share of variable renewables have together made storage the default tool for shifting energy in time and supplying the fast, controllable services a modern grid needs. The engineering discipline now centres on matching the right technology and duration to each application, sizing realistically for depth of discharge and degradation, and designing to a maturing stack of safety and interconnection standards.
Key Takeaways
- Always separate power (MW) from energy (MWh); their ratio – duration – is the strongest filter on technology choice.
- Lithium-ion LFP dominates 1–8 hour stationary applications on the combination of cost, cycle life, and safety; no single technology wins across all durations.
- Size to usable energy at end of life, not nameplate – account for DoD, conversion losses, and degradation, and plan augmentation.
- Safety is engineered, not assumed: design to UL 9540/9540A, IEC 62619, IEC 62933, and NFPA 855, and treat thermal management and fire detection as integral.
- Evaluate on lifecycle cost (LCOS) and realistic, conflict-aware value stacking, not on headline capacity or a single revenue stream.
Future Outlook
Through 2035, expect the storage portfolio to broaden: solid-state and sodium-ion maturing, iron-air and other long-duration technologies filling the multi-day gap, AI-driven control extracting more value from existing assets, and grid-forming inverters paired with storage taking on grid-stability roles once held by synchronous machines. The engineer’s task will shift accordingly – from deploying a single dominant technology toward orchestrating a diverse storage fleet across the full duration spectrum. Storage is no longer a question of whether, but of which, how much, and for how long.
To go deeper on the topics raised here, see the GIEE library on grid integration of distributed energy resources, grid-forming inverters, and renewable energy interconnection under IEEE 1547, and explore GIEE’s professional courses for engineers specifying and evaluating storage systems.